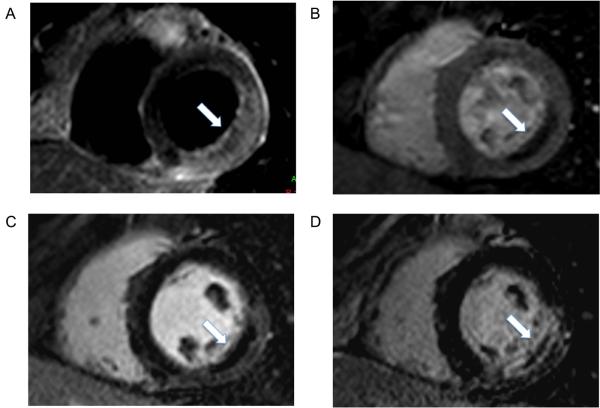
Figure 3.
CMR images taken 24 hours after primary percutaneous intervention in a patient with a lateral STEMI. Panel A shows the T2 weighted images revealing a large area of edema that represents the region of “threatened myocardium” and is clearly larger that the area of late gadolinium enhancement shown in panel D. Resting first pass perfusion in Panel B shows a region of microvascular obstruction in the subendocardial region at the infarct core that closely correlates with the early gadolinium enhanced images (panel C).

