
Figure 3. Phosphorylation of Histone H3 (Ser10) following treatment with Gem ± PD-321852.
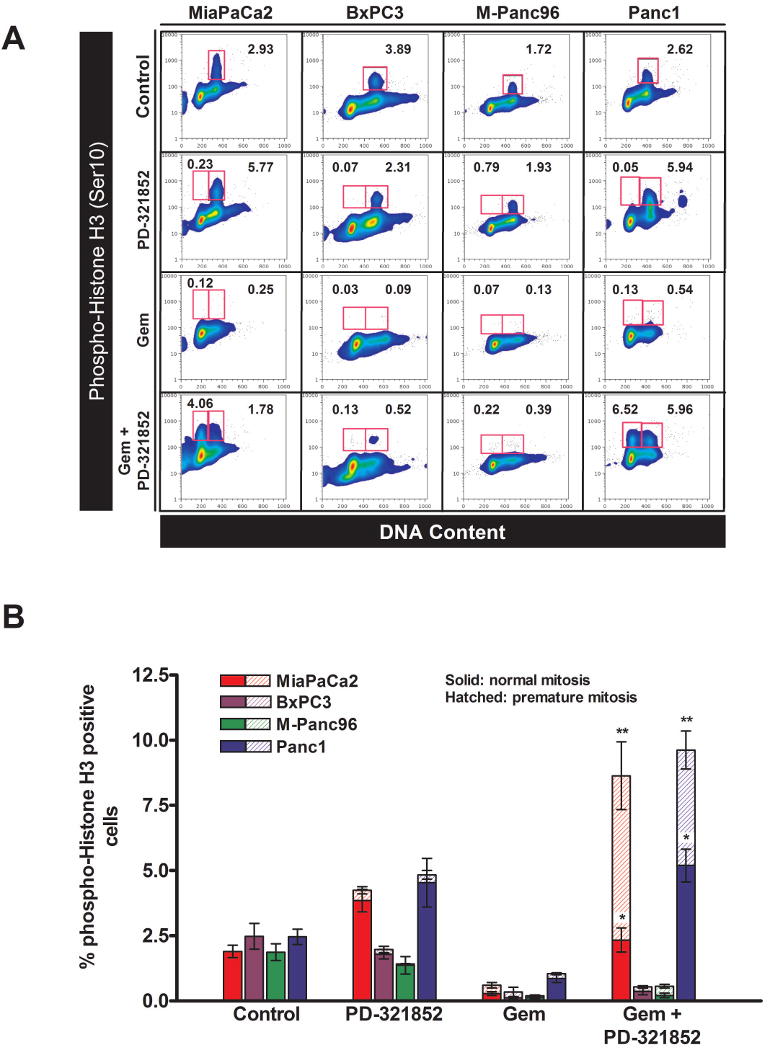
Cells treated with either 100 nM (MiaPaCa2 and BxPC3) 300 nM (M-Panc96) or 1 μM Gem (Panc1) ± 0.3 μM PD-321852 for 24 h were analyzed for phospho-Histone H3 (Ser10) expression, as a function of DNA content, by flow cytometry. Samples shown in (A) are representative of 3-4 individual experiments. Numbers given are the percentage of cells staining positive for phospho-Histone H3 (gated areas). Data presented in (B) are the mean ± SEM (n=3-4; *p<0.05, **p<0.001, compared to Gem alone, one-way ANOVA) of the percentage of phospho-Histone H3-positive cells with either a 4N (normal mitosis – solid bars) or sub-4N DNA content (premature mitosis – hatched bars) for each cell line.