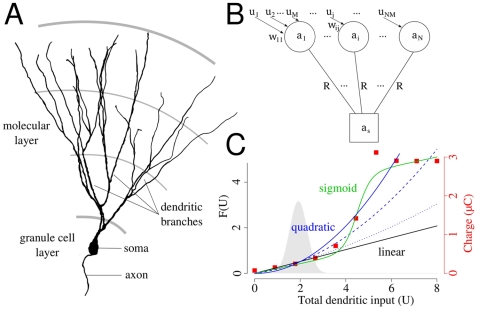
Figure 1. The structure of the model.
(A) Anatomical reconstruction of the dendritic tree of a mature granule cell from mice. The dendritic tree is dominated by the long parallel dendritic branches in the outer two third of the molecular layer. Note the lack of basal dendrites and the apical trunk compared to a pyramidal neuron. Image courtesy of Dr. Josef Bischofberger. (B) Model for the somato-dendritic interactions in dentate granule cells. Distal dendritic compartments are represented by circles, and the soma by a square. Further details are in the text. (C) The different dendritic integration functions used in this study. Black: linear, blue: quadratic, green: sigmoid function. Red, square symbols indicate the nonlinearity of dendritic integration in a conductance based model of hippocampal granule cell (see Text S1). Dashed and dotted lines show different degrees of nonlinearity. The distribution of the total dendritic input with uniform synapses is shown in the background.

