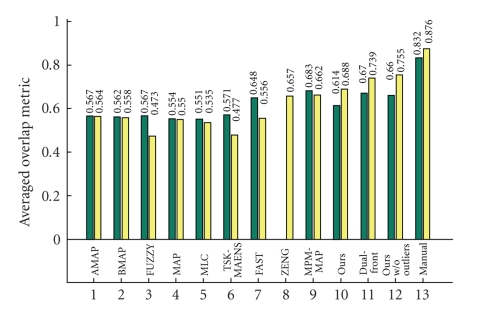
Figure 15.
Average OM for WM and GM segmentations on 20 normal real brain data of T1-weighted modality. The left and right columns denote the average OM of WM and GM segmentation respectively. Some statistics are from IBSR and others are from [5]. They represent: AMAP: adpaptive MAP, BMAP: biased MAP, FUZZY: fuzzy C-means; MAP: Maximum a posteriori probability, MLC: maximum likelihood, TSK-MEANS: tree-structure k-means, FAST: hidden Markov method [15], ZENG: coupled-surface method [1], MPM-MAP: Bayesian method [14],and Dual-front: Dual-front method [5].

