
Figure 4. Ly49G2+ NK cells respond selectively to MCMV infection.
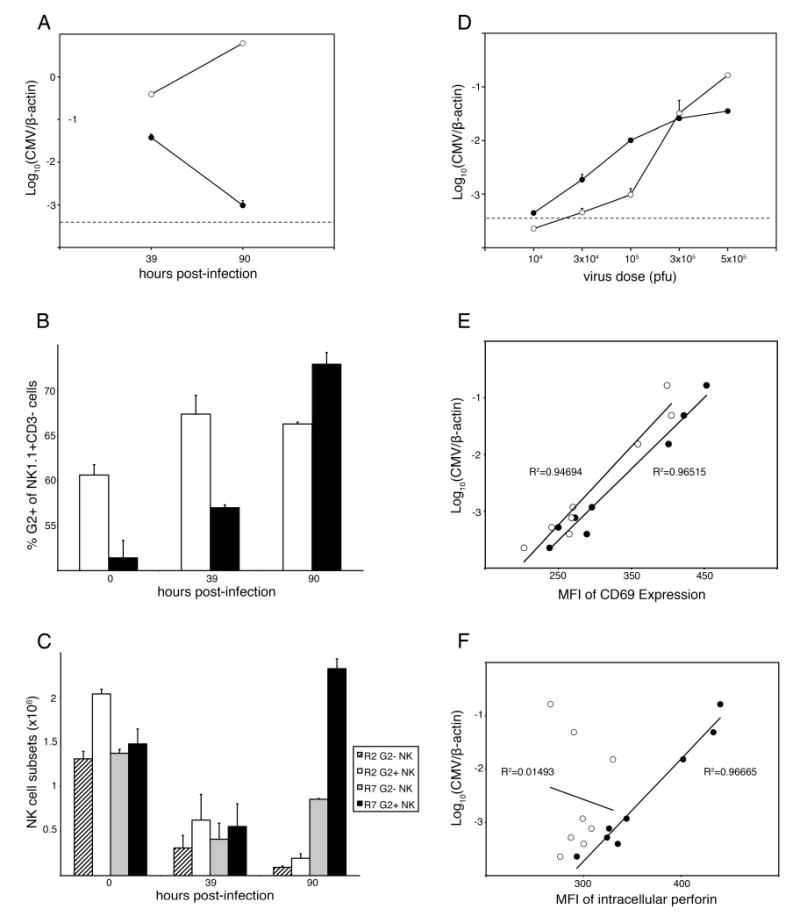
R2 and R7 mice were infected with 105 PFU MCMV (A-C) or with the indicated dose in the range 104 to 5 × 10⁵ PFU (D-F). A. Average MCMV genome levels for R2 (open) and R7 (filled) spleens are shown. B. R2 (open) and R7 (filled) splenocytes were stained for NK1.1, CD3 and Ly49G2 (4D11). Numbers indicate the mean percentage of NK cells expressing Ly49G2+ at the cell surface at the indicated times after MCMV infection. C. As in B, but values represent total numbers of G2+ and G2- NK cells in R2 and R7 spleens after infection. R2 NK cells in spleen, regardless of G2 expression, decreased at 90 h after infection (P < 0.005). In R7 spleen, G2- NK cells decreased by 39 h after infection and were still significantly lower than in control spleen at 90 h after infection (P < 0.005). On the other hand, only R7 G2+ NK cells increased significantly between 39-90 h after infection until they were also higher than in uninfected R7 spleen (P < 0.05). D. Groups of R7 mice were infected with the indicated dose of MCMV. Shown are average MCMV genome levels for spleen (open) and liver (filled) at 90 h after infection. The limit of MCMV detection (dashed line) is indicated. E. and F. Splenocytes from R7 mice in (D) were stained for NK1.1, Ly49G2 (4D11) and cell surface CD69 (E) or intracellular perforin (F). Plots show MCMV genome levels and mean fluorescence intensity (MFI) values for G2- (open) and G2+ (filled) NK cell subsets for individual animals. The correlation exponential trend lines with R2 values are shown. Data are representative of at least two independent experiments. Error bars indicate standard deviation. Statistical analysis was performed using a Student T-test.