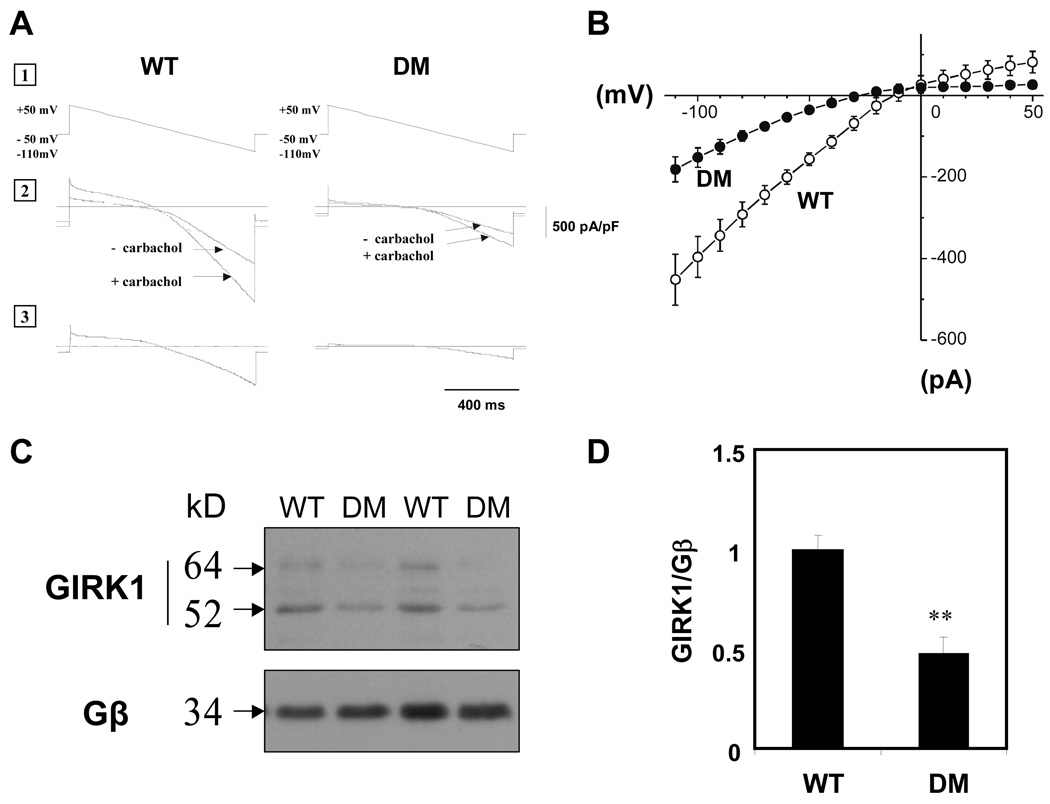
Figure 2. IKAch in atrial myocytes and atrial GIRK1 expression are decreased in Akita mice compared to WT.
A. Current-voltage (I-V) relationship of the carbamylcholine-induced whole cell currents elicited from a 1 second voltage ramp with a continuously changing voltage from +50 to −110 mV, from a holding potential of −50 mV (1). Current in a typical atrial myocyte with and without 20 µM carbamylcholine (2). Current generated by subtracting curves (1) from (2) (3). B. I-V plots constructed from a series of data points in Fig. 2A, panel 3. Data are the mean of 5 determinations each from 3 Akita and 3 WT mice. C. Western blot analysis of GIRK1 expression in atria of WT and Akita mice. D. Densitometry analysis of both glycosylated (64 kD) and unglycosylated (52 kD) GIRK1 bands determined by autoradiographs from 6 WT and 6 Akita mice normalized to the expression of Gβ, (**P<0.01).

