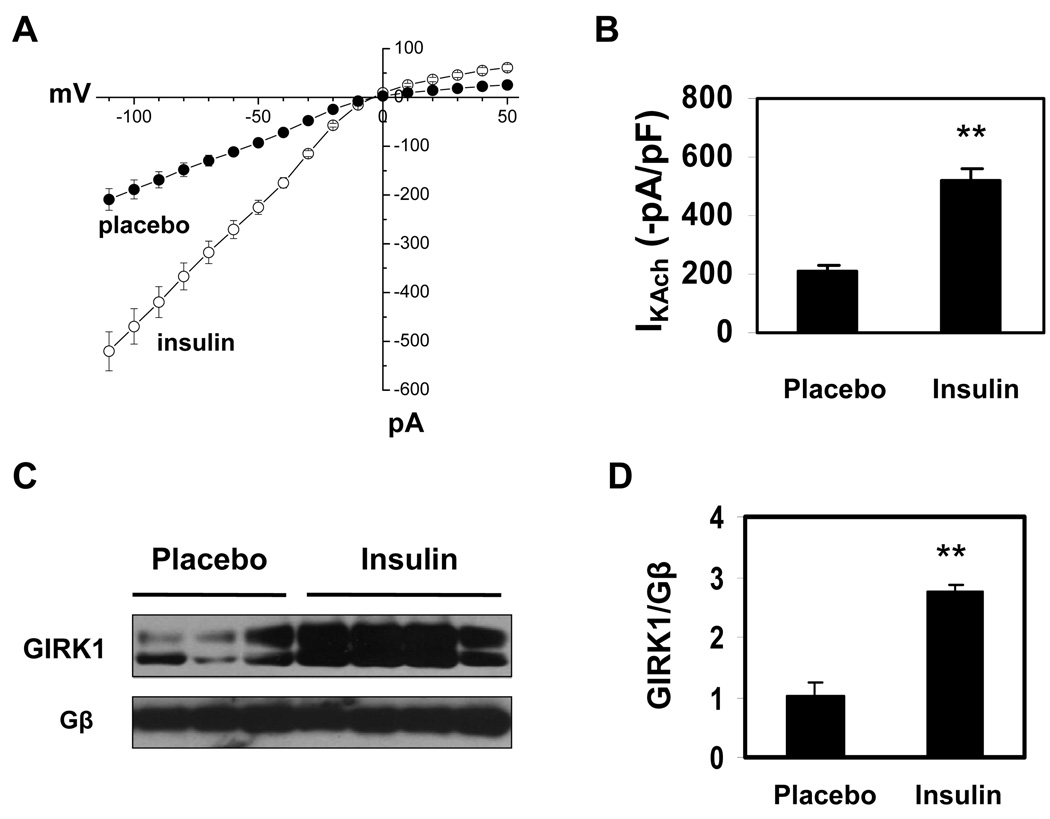
Figure 4. Effect of insulin on IKAch and GIRK1 expression in Akita mice.
A. IKAch was determined as described in Fig. 2A and I-V plots constructed. Data are the mean of 8 recordings from 3 placebo treated and 9 recordings from 3 insulin treated Akita mice. B. Quantitation of peak inward currents from A. C. Expression of GIRK1 in atria from placebo and insulin treated Akita mice determined by Western blot analysis. D. Densitometry analysis of both glycosylated and unglycosylated GIRK1 bands in C (n=4)*. Data were normalized to the expression of Gβ. **P<0.01.

