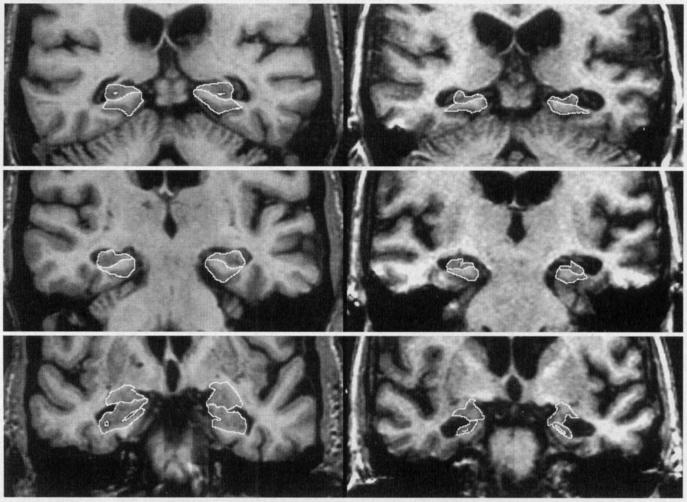
Figure 1. Neuroanatomic Boundaries.
Two columns of images are presented. On the left, cropped oblique coronal MR images through the temporal lobes of a 75 year-old female control, and on the right images from a 73-year-old female AD patient, CDR = 1. In each column, 3 images are present. From the top to bottom, these represent sections at the level of the hippocampal tail, hippocampal body, and hippocampal head. The anatomic outlines of the hippocampus, and PHG are indicated on images of the hippocampal head, and hippocampal body. The outline of the amygdala and hippocampus are indicated in the bottom image of the hippocampal head. Neuroanatomic criteria employed when tracing the boundaries of these 3 MTL structures are indicated in the text.

