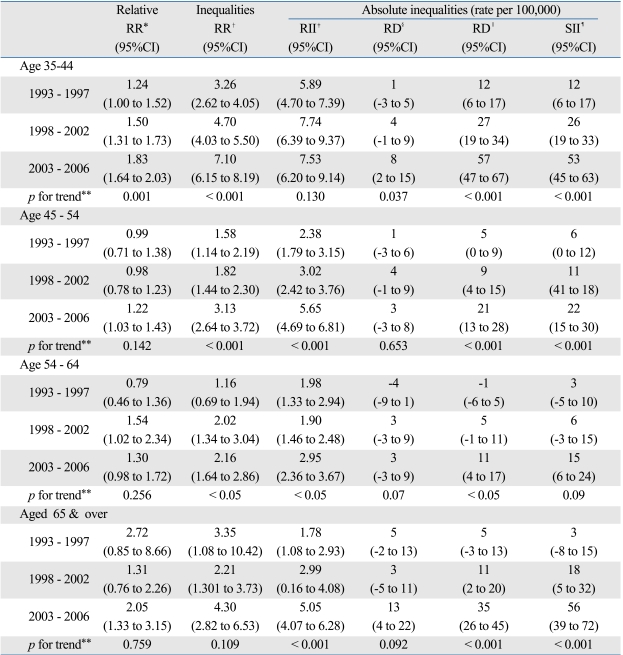
Table 4.
Differentials in Suicide Mortality by Age Group and Educational Level, with 95% Confidence Intervals and p Values for Trend during the Study Periods (1993 - 2006), among Females Aged 35 and Over
CI, confiderce interval; RR, relative ratio; RII, relative index of inequality; RD, relative difference; SII, slope index of inequality.
*Rate ratios in those with middle or high school education compared to those with college or higher education, were driven from β2 estimates (see equation 1).
†Rate ratios in those with no education or elementary school education compared to those with college or higher education, were driven from β2 estimates (see equation 1).
‡Relative index of inequality is the relative rate for the expected mortality for the lowest educated compared with the highest educated (see method).
§Rate differences between those with middle or high school education and those with college or higher education, were driven from β2 estimates (see equation 2).
∥Rate differences between those with no education or elementary school education and those with college or higher education, were driven from β2 estimates (see equation 2).
¶Slope index of inequality is the expected rate difference of the lowest educated and the highest educated (see method).
**Represents linear increase across the study periods for each age group by inequality index, was deriven from the period† edu interaction term (see method).

