
Figure 3. Gene specific alteration of TGFβ1 transcriptome by v-rasHa.
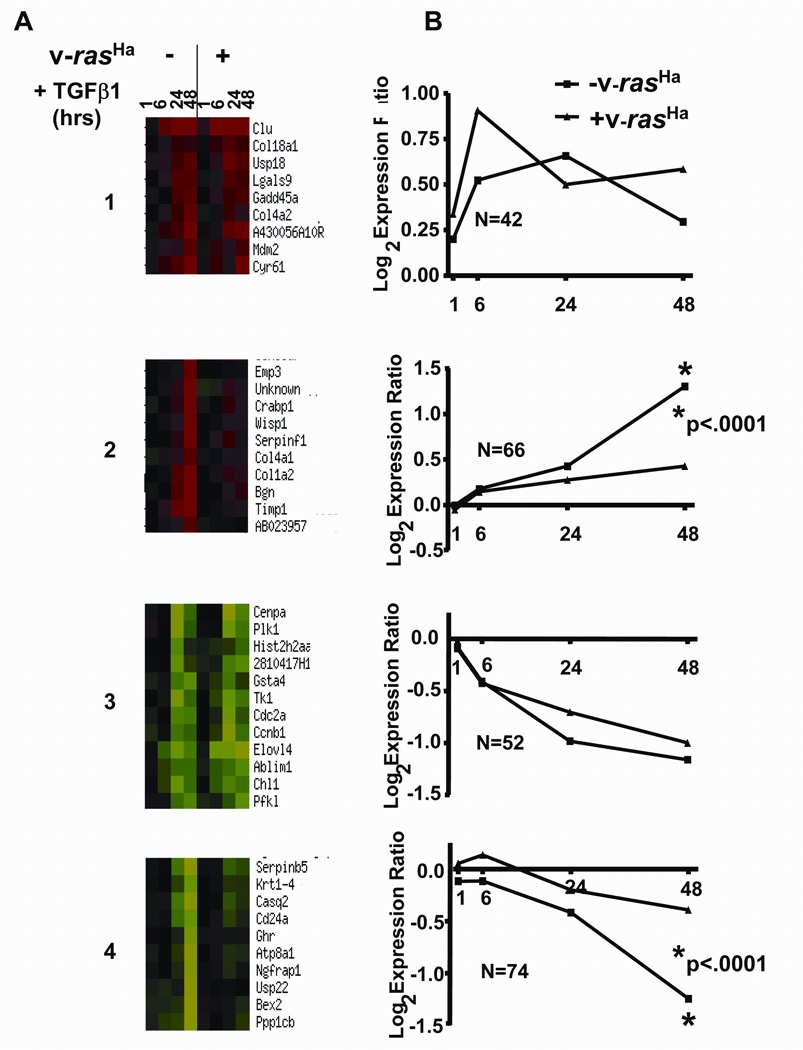
Primary and v-rasHa transduced keratinocytes were treated with TGFβ1 and microarray analyses were performed on RNA isolated at the indicated times as described in Materials and Methods. A Representative portions of major clusters of expression patterns obtained using the K-means cluster program from the NCI mAdbweb site. Cluster1: Similar induction by TGFβ1 in control and v-rasHa expressing MEK; Cluster 2: Induction by TGFβ1 suppressed in v-rasHa expressing MEK; Cluster 3: Similar repression by TGFβ1 in control and v-rasHa expressing MEK; Cluster 4: Suppression by TGFβ1 blocked in v-rasHa expressing MEK. Each time point in the heat map represents the averaged (5–8 arrays) log2 transformed expression ratio calculated from TGFβ1 treated cells over untreated control cells. Red indicates overexpression in TGFβ1 treated cells while green indicates underexpression in TGFβ1 treated cells as compared to controls. B. Plots of the average log2 expression ratio at each time point for all genes within the corresponding cluster in A. N is the number of genes in each cluster used for the analysis, and p values were computed using a nonparametric T test from the values of the 48 hr time points.