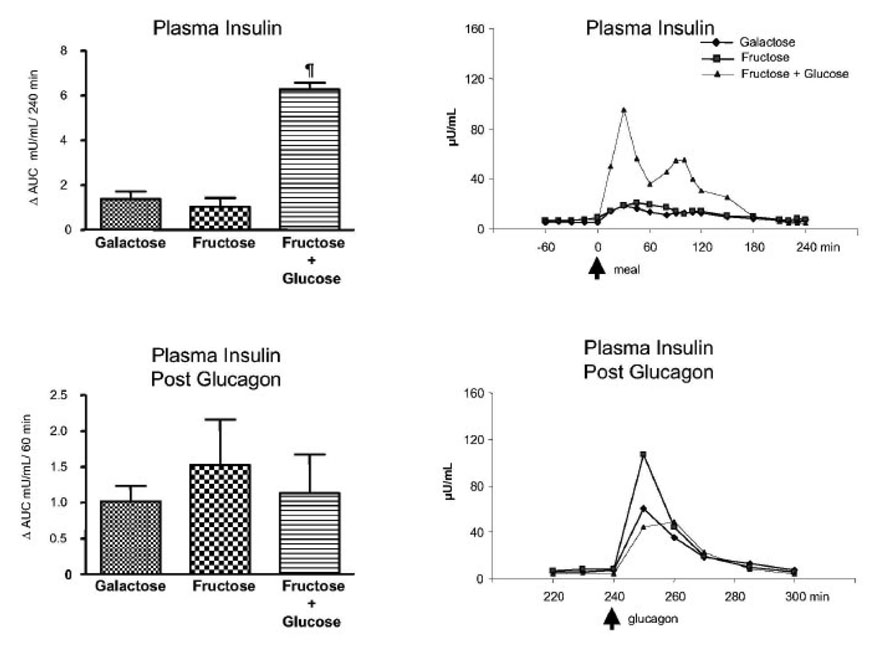
Fig. 2.
Plasma insulin concentration. Left upper panel: ⋗ AUC for plasma insulin concentrations (mU/mL)/240 min (0 to 240 min after subtraction of baseline values). ¶ p < 0.05 Fructose + glucose vs. galactose and fructose bolus by ANOVA. Left bottom panel: ⋗ AUC for plasma insulin concentrations (mU/mL)/60 min after the glucagon infusion (240 to 300 min after subtraction of the pre-glucagon 240 min value). Right upper panel: Average values of the plasma insulin concentration (µU/mL); 0 min represents the time of the drink ingestion. Right bottom panel: Average values of the plasma insulin concentration after the glucagon infusion (µU/mL) (240 to 300 min); 240 min represents the time of the glucagon administration. Values represent mean ± SE for n=3.

