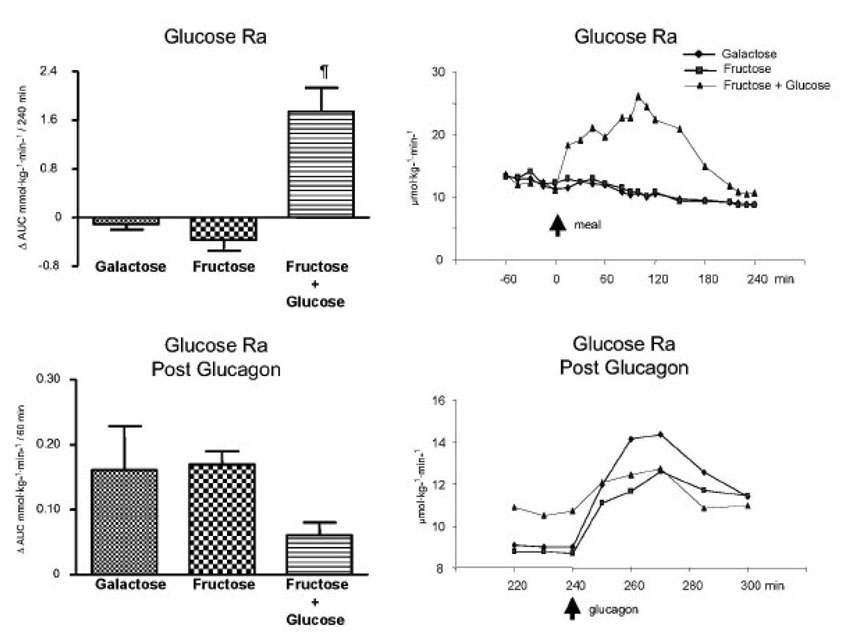
Fig. 3.
Glucose rate of appearance. Left upper panel: ⋗ AUC for glucose rate of appearance (Ra) (mmol·kg−1·min−1) /240 min (0 to 240 min after subtraction of baseline values). ¶ p < 0.05 Fructose + glucose vs. galactose and fructose bolus by ANOVA. Left bottom panel: ⋗ AUC for glucose rate of appearance (Ra) (mmol·kg−1·min−1) /60 min after the glucagon infusion (240 to 300 min after subtraction of the pre-glucagon 240 min value). Right upper panel: Average values of the glucose rate of appearance (Ra) (µmol·kg−1·min−1); 0 min represents the time of the drink ingestion. Right bottom panel: Average values of glucose rate of appearance (Ra) (µmol·kg−1·min−1) after the glucagon infusion (240 to 300 min); 240 min represents the time of the glucagon administration. Values represent mean ± SE for n=3.

