Figure 2.
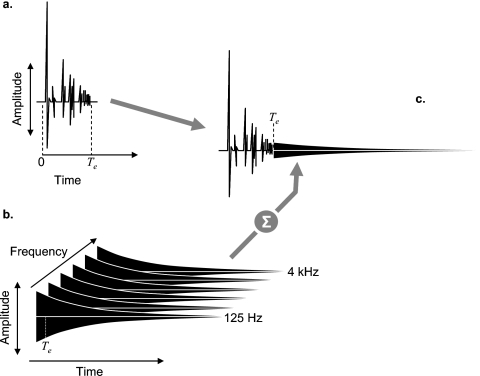
Schematic representation of the BRIR modeling procedure. (a) Stylized representation of the early portions of the BRIR (one ear only) estimated using an image model (Allen and Berkley, 1979) and then spatially rendered using HRTFs. The time axis represents the duration of the early response, Te, relative to the start of the direct-path response (0). (b) Stylized representation of the late response modeling procedure in which noise samples shaped by exponentially decaying envelopes are generated in each of six octave bands (125 Hz–4 kHz) and then summed and scaled (see text for details). (c) Representation of the combined early and late responses for one ear. Identical procedures were implemented to estimate the response of the other ear.

