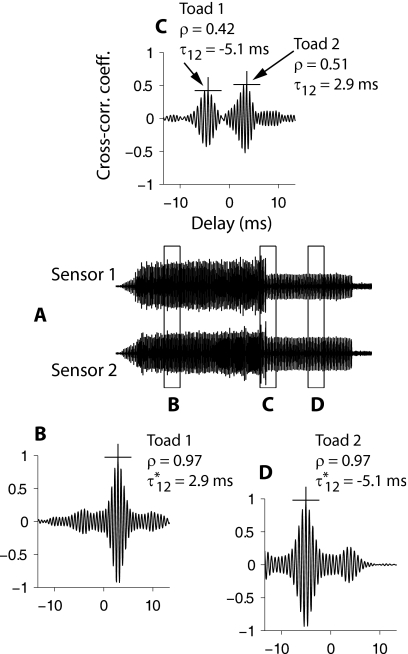
Figure 4.
Time-domain cross-correlation to test for the presence of a single caller in a selected frame. (A) shows bandpass (B1) filtered outputs from two sensors 1 and 2. Three representative time frames B, C, D are shown as rectangular windows. The corresponding cross-correlation functions are shown in panels B, C, and D, respectively. For frames B and D, the maximum in the cross-correlation function is marked (+), and the ρ and maximizing delay are also shown. These frames have one dominant caller each: toad 1 (frame B) and toad 2 (frame D) and ρ exceeds threshold (γ=0▷65). Frame C has both callers as seen from the two peaks in the cross-correlation function at the delays exhibited by toad 1 (panel B) and toad 2 (panel D). Consequently, the cross-correlation function is broad and neither peak exceeds γ. This frame was discarded. Note that the two callers can be visibly distinguished in the sensor data except in the overlapping region (see also the identical segment shown in Figs. 3(B1) and 3(B2)).

