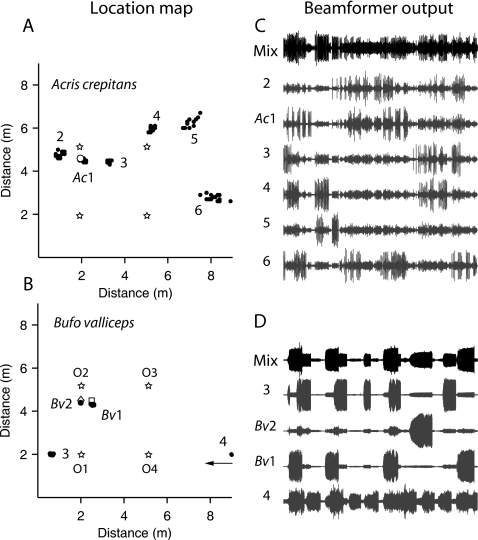
Figure 6.
Location maps [(A) and (B)] for cricket frogs and Gulf Coast toads in the xy plane (ground), and their beamformer outputs [(C) and (D)]. Microphone locations are shown as 1–4 [open stars in (A) and (B)]. The location of each individual is a numbered cluster. Visually observed individuals are marked Ac1 (panel A, ○) and Bv1 and Bv2 (panel B, ◇ and ◻, respectively). In panel B cluster 4 represents two toads located outside the analysis arena (x>9 m, y<2 m). See text for further explanation. Beamformer outputs for each individual are shown in gray. The filtered bandpass output from a representative microphone (mic 2) are shown in black (“Mix”).

