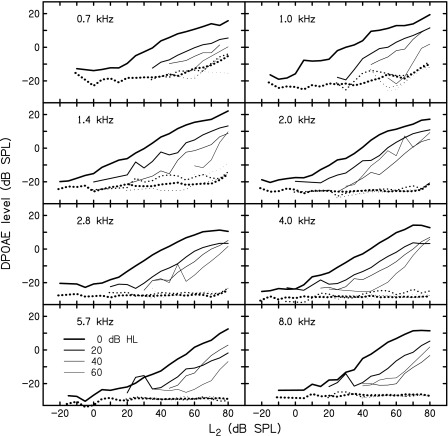
Figure 1.
Median DPOAE levels (solid lines) as a function of stimulus level. Each panel shows four different HL categories (0, 20, 40, and 60 dB HLs) at the indicated f2 frequency. The HL category is indicated by the line weight from heavy (0 dB HL) to light (60 dB HL). The dashed lines indicate the median noise level at f2 corresponding to each I∕O function.

