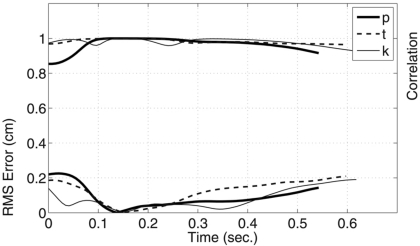
Figure 10.
Comparison of the reconstructed VCVs of Fig. 9 to the original time-varying cross-distance functions shown previously in Fig. 3. The lower part of the plot indicates the rms error between the cross-distance functions at every time frame over the course of each utterance. The upper part shows the correlation coefficients calculated at each time frame. Note the axis label for the rms error is on the left side of the plot and on the upper right side for the correlation coefficients.

