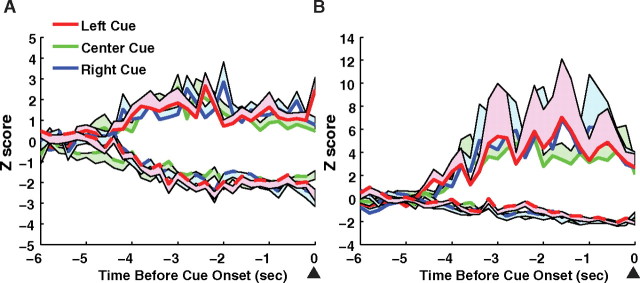
Figure 7.
Precue activity for each cue location. ACC (A) and mPFC (B). Precue responsive cells were divided into three groups, depending on which of the three cue holes illuminated during that trial. No difference in excitatory or inhibitory responses was observed between cue locations (cue location × time interaction, p > 0.05). The lines represent the mean activity and the shaded areas represent the SE.

