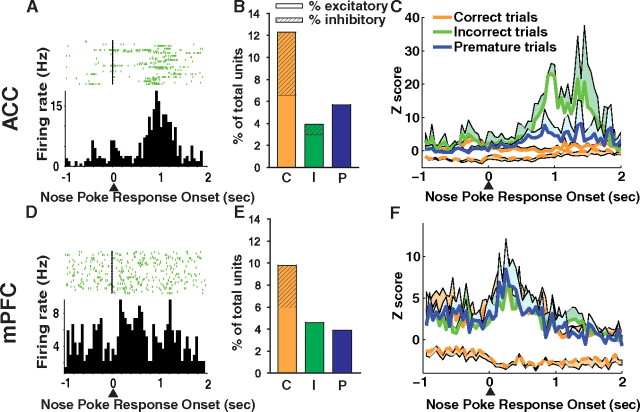
Figure 8.
Cue hole nose poke-related single-unit activity. ACC (A–C, top) and mPFC (D–F, bottom). Nose pokes into the cue holes were divided into three groups: correct, incorrect, and premature (before the cue light). A, D, Single-unit examples of excitatory units that responded on incorrect cue hole nose pokes. B, E, The percentage of total units which responded during a −1 to +1 window around cue hole nose poke onset. Excitatory units are shown as solid bar and inhibitory units are shown as hashed bar. A similar proportion of units responded in each region. Correct cue hole nose pokes were associated with a significant number of inhibitory responses. C, F, The population activity (excitatory, solid line; inhibitory, dashed line) of cue hole nose poke-responsive units. Neural activity is aligned with nose poke entry into the cue hole (arrow). The lines represent the mean activity and the shaded areas represent the SE. No difference was found between activity in the PFC (trial type × time interaction, p > 0.05), but a phasic response to incorrect cue hole nose pokes was observed in the ACC (p < 0.01).

