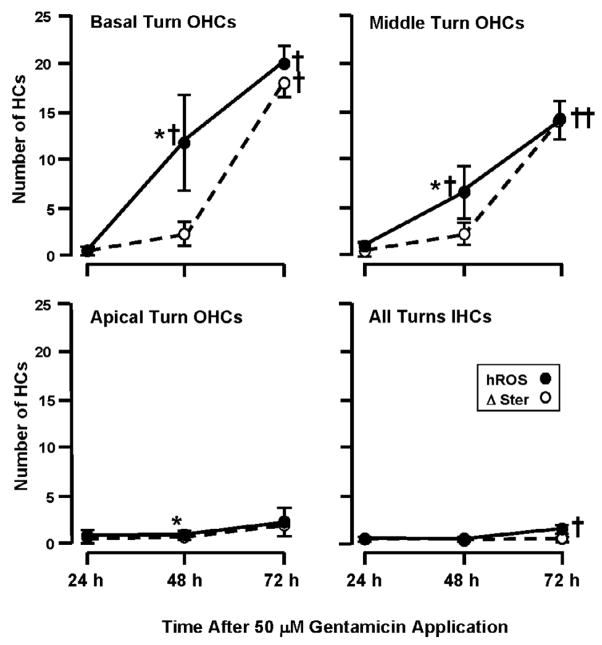
Fig. 6.
The relationship between the number of cells showing hROS versus those showing loss of stereocilia in chronic, 50 μM GM-treated OHCs of the basal, middle and apical turns, and in the IHCs of all turns combined. Data from APF and HPF have been combined for this and the following figure, thus the numbers differ slightly from those presented in the text. In basal turn OHCs, probe fluorescence (hROS) showed a linear increase over time, while loss of stereocilia (Δ Ster) was delayed, with no significant difference between 24 h and 48 h but an abrupt rise at 72 h. Middle turn OHCs showed a similar pattern, although the levels of hROS and damage were less than in the base. Apical turn OHCs showed little hROS or stereociliary damage (although a slight difference between hROS and damage at 48 h was significant due to extremely low variability). IHCs also showed little HC hROS or damage. † = significant difference (P < .05) from 24 h and control values. * = significant difference (P < .05) between hROS and stereocilia loss.

