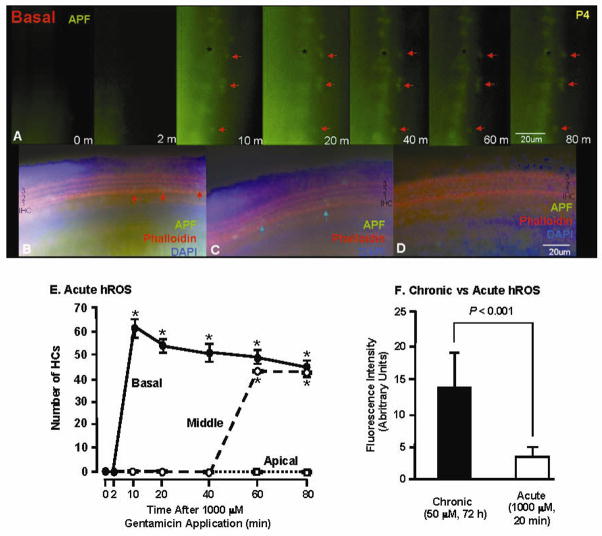
Fig. 8.
Detection of hROS in HCs exposed acutely to 1000 μM GM using the APF probe. Panel A illustrates the development of fluorescence in the living organ of Corti over time, while Panel B shows the same tissue after fixation and cytochemical processing. The fluorescently labeled HCs in A and B are indicated by red arrows. GM-induced HC fluorescence was initially detected at 10 min, primarily in the first row of OHCs but also in occasional IHCs (A, B, E), and remained relatively constant for 80 min, after which the tissue was fixed for histochemistry. No stereocilia loss was observed at 80 min (B). Fluorescence is also visible in cells immediately inside the HC region (* in A), but unlike HC fluorescence this was also seen in tissue not treated with GM, and may represent cells damaged during tissue dissection or tectorial membrane removal. In the middle turn (C, E), fluorescence (blue arrows) was first observed at 60 min, also primarily in the first row of OHCs and a few IHCs. In the apical turn (D, E), no evidence of hROS formation was detected. (E) The intensity (= intensity of cells minus background intensity) change of fluorescence in labeled HCs during the acute response to high-dose GM exposure. * = significantly different than time 0 and control (P < .05). (F) The intensity of APF fluorescence was higher in HCs exposed chronically to low-dose GM (72 h) than in HCs exposed acutely (20 min) to high-dose GM, suggesting less formation of hROS during acute than in chronic GM exposure.

