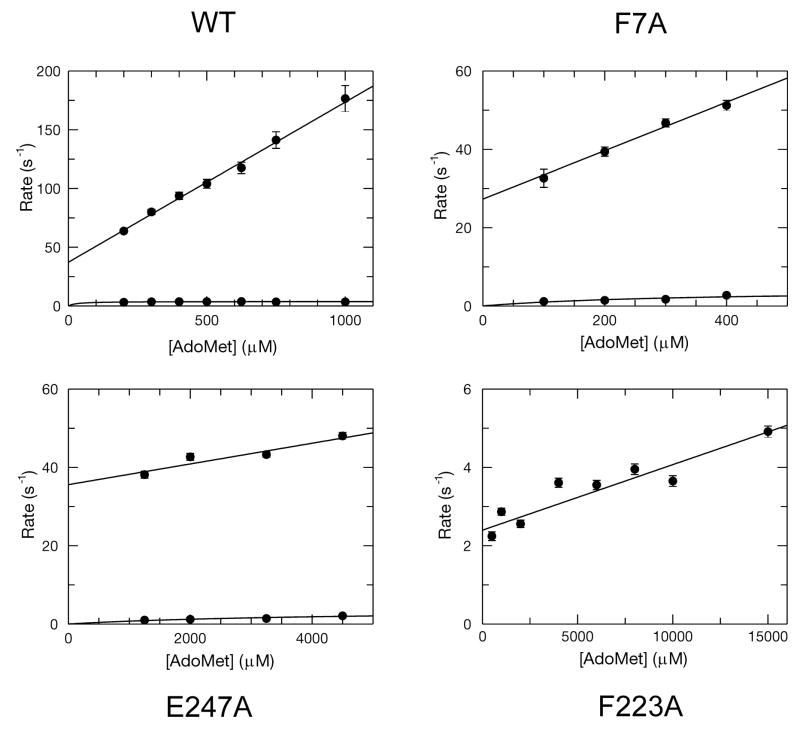
Figure 3.
Plots of observed rate vs. [AdoMet] for the WT, F223A, F7A and E247A mutants. The linear concentration dependence of the observed rates was fit using a line which allowed for the definition of k1 and k−1. A hyperbolic fit of the slow phase defined the sum of k2 and k−2, except in the case of F223A, where the kinetics were monophasic and indicative of a more simple one step binding model. In this case the slope of the best fit line defines the k1 and the y-intercept defines the k−1 directly.

