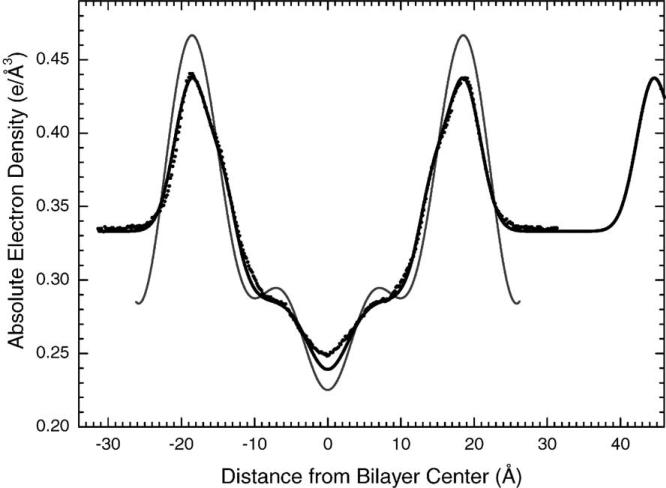
Fig. 15.
Electron density profile of DOPC at 30 °C constructed using the model fitting method and the X-ray intensity data from a fully hydrated, oriented sample (black line). For comparison is the DOPC profile constructed by Fourier construction using data from an unoriented sample (Tristram-Nagle et al., 1998) (gray). Also shown is the DOPC profile obtained by MD simulations by Scott Feller (black dots).

