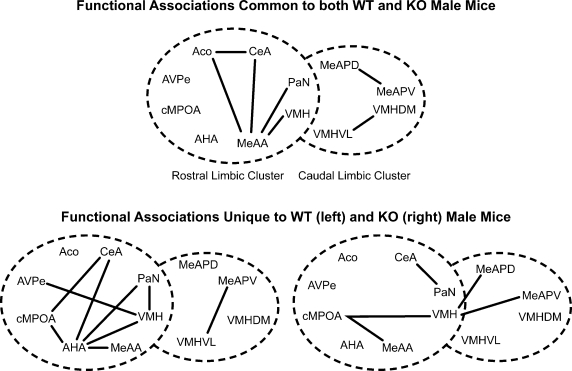
Figure 6.
Effect of the individual's Genotype on functional connectivity in male mice independent of the sibling's genotype or sex. Top panel indicates functional connections common to ♂WT and ♂ERKO mice. Bottom panel indicates functional connections unique to ♂WT (left) or ♂ERKO mice (right). Connections based on Table 1A in Supplementary Material, α = 0.01. Each series of nuclei encircled by a dotted line represents a limbic cluster. The left circle in the foreground is the mRLC and the right circle in the background is the mCLC.

