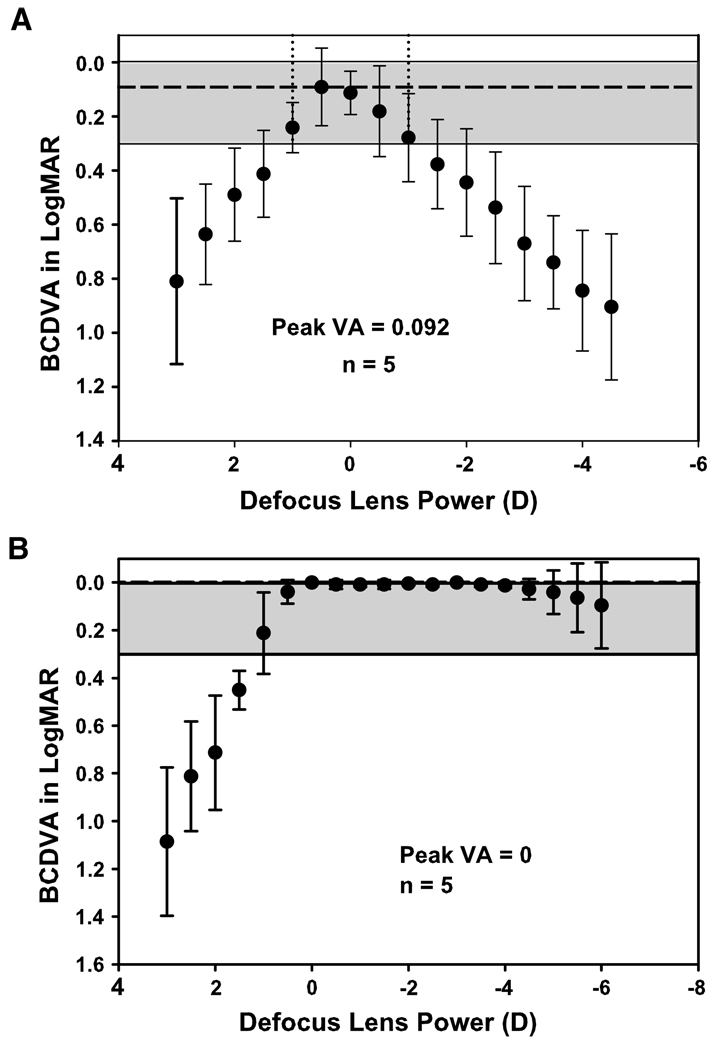
Figure 3.
A: Defocus curve from 10 pseudophakic subjects measured behind a phoropter with lens powers ranging from +3.00 to −4.50D in −0.50 D steps. The vertical dashed lines represent the range of distance-corrected visual acuities better than 20/40 (0.30 logMAR), which is represented by the gray area. B: Defocus curve from 5 young phakic subjects measured behind a phoropter with lens powers ranging from +3.00 to −4.50 D in −0.50 D steps. The gray area represents the range of distance-corrected visual acuity better than 20/40 (0.30 logMAR) (BCDVA = best corrected distance visual acuity; Peak VA = mean best starting visual acuity for this population).

