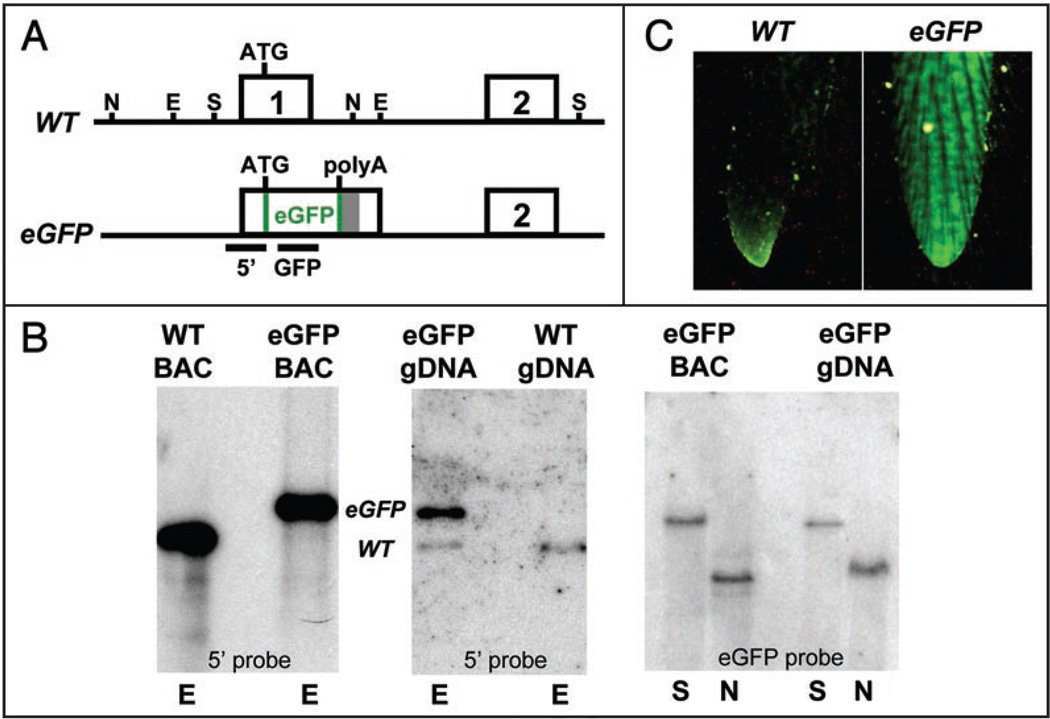
Figure 1.
Generation of p107 BAC-eGFP transgenic mice. (A) Schematic representation of the p107 BAC knock-in reporter. Exons are indicated by numbered boxes. A polyadenylation site (grey bar) is placed directly downstream of the eGFP cDNA. The 5' and GFP bars indicate DNA probes for Southern blots—E, EcoR1; N, Nde1; S, Sac1. (B) Southern blot analysis of the wild-type and the eGFP-transgenic allele of p107 demonstrates that multiple copies of a large fragment of the p107-eGFP BAC have integrated into the mouse genome. The left and middle panels are EcoR1 digests. WT represents the 4.6 kb wild-type band while eGFP represents the 5.6 kb transgene band obtained with a 5' probe—left panel, BAC DNA; middle panel, genomic DNA (gDNA). In the right panel, with an eGFP probe, a Sac1 digest of BAC and gDNA indicates the presence of a 15.5 kb band (top band) that corresponds to the transgene. The Nde1 digest of the eGFP-transgenic mouse gDNA shows the expected 7.5 kb band. (C) p107 BAC-eGFP transgenic mice are genotyped through direct visualization of eGFP expression in the tail under a UV light.

