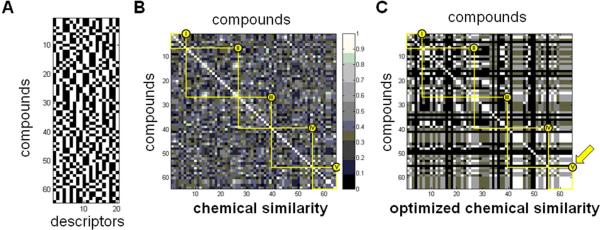
Figure 10. Illustration of optimization to identify subsets of stereochemical features linked to biological performance similarity.
(A) 64 × 20 matrix displaying a 20-feature “binary fingerprint” for each disaccharide, with bits representing the (L-/D-) chirality of the sugar monomers, the anomeric bond configurations, and the relative stereochemistry of each additional stereocenter in the molecule. Compound identities are listed in the same order as in Figure 7B; thus, the numbers along the vertical axis represent the row number from Figure 7B, rather than the compound identifiers from Table 1. (B) Pairwise structure similarity using the complete set of 20 binary descriptors; compound identities are in the same order as Figure 7B; thus, the numbers along the horizontal and vertical axes represent the row number from Figure 7B, rather than the compound identifiers from Table 1. Each element (i,j) in this matrix represents the similarity between the ith row and the jth row of (A), as defined by the Tanimoto coefficient between fingerprint vectors (rows) in (A). (C) 64 × 64 similarity matrix of optimized pairwise structure similarity, using a 3-bit representation selected by focusing on cluster V (see text); thus, each element is constructed as in (B), but using only a subset of the columns of (A) for the Tanimoto calculation. Compound identities and grayscale are the same as in (B).

