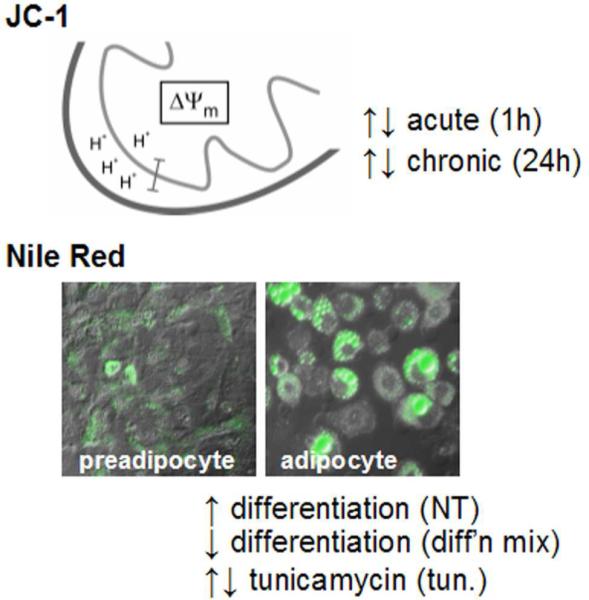
Figure 4. Cell-based assays using disaccharide library.

Schematic depicting the proton gradient established in the mitochondrial inner membrane, resulting in a membrane potential (ΔΨm) measured by JC-1 fluorescence, and example of adipocyte differentiation measured by Nile Red staining (green fluorescence). Each image is an overlay of differential interference contrast and green fluorescence (480nm/530nm) channels. Assays were performed to identify compounds that increase differentiation (NT), decrease differentiation (diff'n mix), or modulate the effects of the differentiation inhibitor tunicamycin (tun.).
