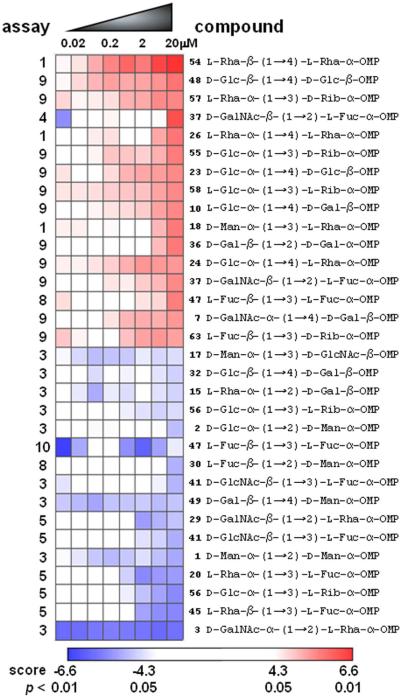
Figure 6. Analysis of dose-dependent compound effects.
Heat map of assay results, focusing on the 32 most-active compounds as judged by relative dose-dependent increase (top 16) or decrease (bottom 16) of normalized assay signal. Assays are numbered on the left according to the numbering scheme in Figure 5. Heat-map data are expressed as signed log(p) values based on ChemBank scores32, with the color scheme indicated; compound ranks were determined by the dose-dependent (left-to-right) slope, using a moving average of signed log(p) values (see Methods).

