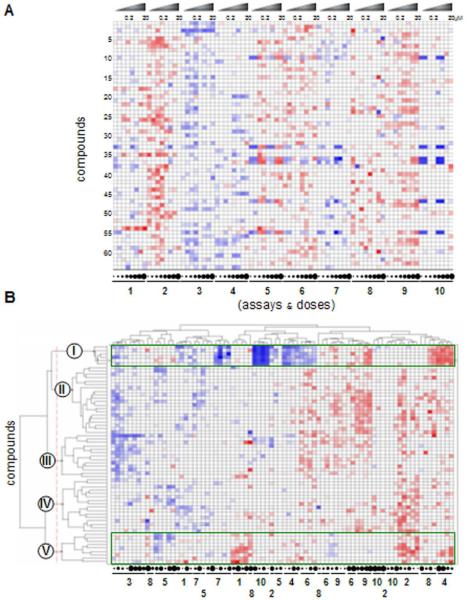
Figure 7. Analysis of compound similarity based on assay performance.
(A) Primary cell-state and dose-response measurements (“performance profiles”) of 64 disaccharides tested at 8 concentrations in 10 assays; compounds (rows) are presented in the order enumerated in Table 1, and dose-responses are presented for each assay in the order enumerated in Figure 5. Rows represent concatenation of 10 different dose-responses for each compound, such as those presented in Figure 6. Compound concentrations are alternatively represented by circles beneath the heat-map, with increasing size corresponding to increasing concentration, at the dilutions indicated. (B) Unsupervised hierarchical clustering of 80-dimensional performance profiles for all 64 compounds. The five biological clusters, resulting from an inter-cluster similarity cutoff of 0.25, are represented by Roman numerals, while assay identities and concentrations are depicted below the heat-map with the same scheme as in Figure 5. Color scheme for signed log(p) values is the same as in Figure 6. This visualization represents the same data as in (A), but with an alternative row and column order resulting from the hierarchical clustering.

