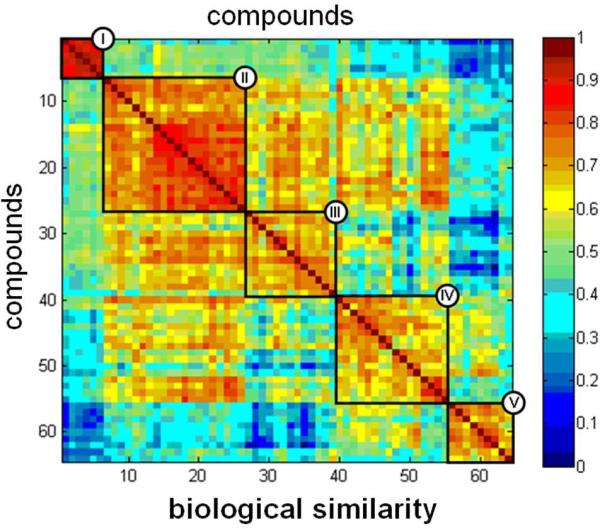
Figure 9. Analysis of biological similarity.

64 × 64 matrix of pairwise biological performance similarities based on correlations (cosine correlation method) between assay profiles. Each element (i,j) in this matrix represents the similarity between the ith row and the jth row of Figure 7B. Similarity values were scaled to the range [0,1] and displayed using the color legend shown. Compound identities are listed in the same order as in Figure 7B, with clusters indicated by Roman numerals; thus, the numbers along the horizontal and vertical axes represent the row number from Figure 7B, rather than the compound identifiers from Table 1.
