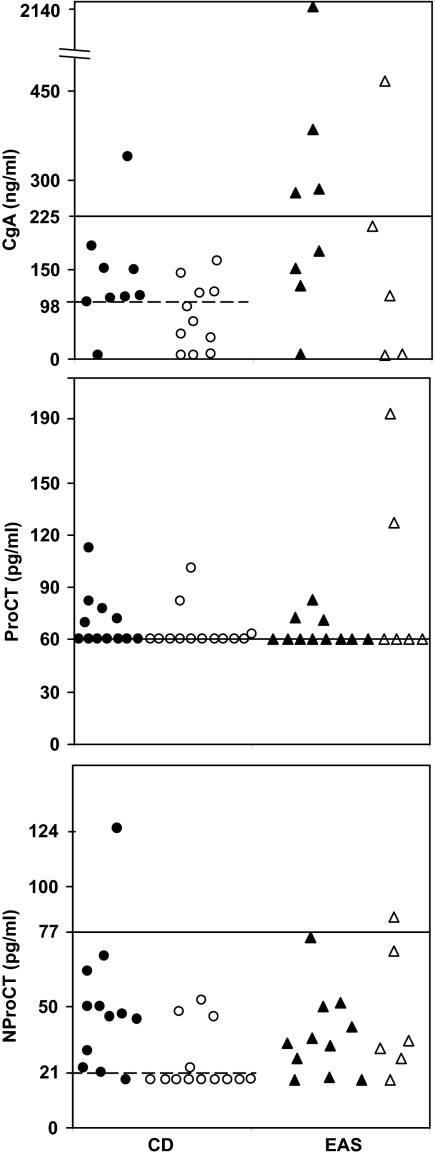
Figure 1.
Scatterplots of CgA (top), ProCT (middle), and NProCT (bottom) levels in patients with CD with (•) and without (○) tumor invasion and in patients with EAS with identified tumors(▴) and occult tumors (▵). The horizontal line represents the upper normal limit for the assay. The dashed horizontal line represents the cutoff value in patients with CD that suggests the presence of an invasive tumor. The functional detection limits of the assay are 5 ng/ml (5 μg/liter) for CgA, 60 pg/ml for ProCT, and 20 pg/ml for NProCT.

