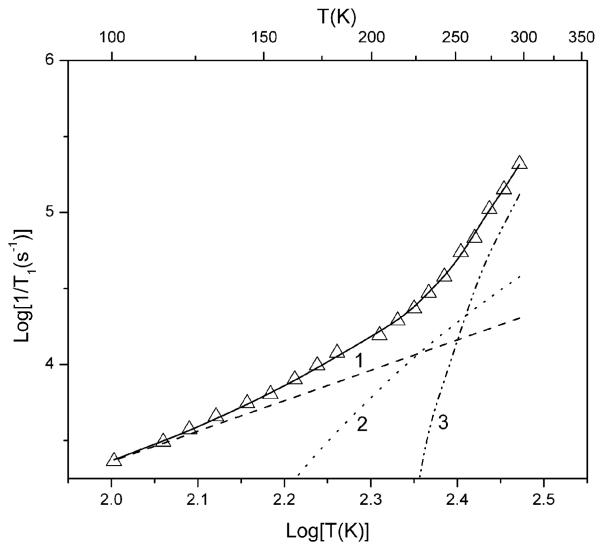
Fig. 4.
Modeling of the temperature dependence of spin lattice relaxation rates for hydroxy-DICPO in 1 : 1 water-glycerol, measured in the center of the X-band spectrum. The solid line is the sum of contributions from the Raman process (line 1), the local mode (line 2), and modulation of g and A anisotropy by tumbling (line 3). Although spin-rotation was included in the fit line, the contribution is so small that a line depicting that contribution is not included in the figure.

