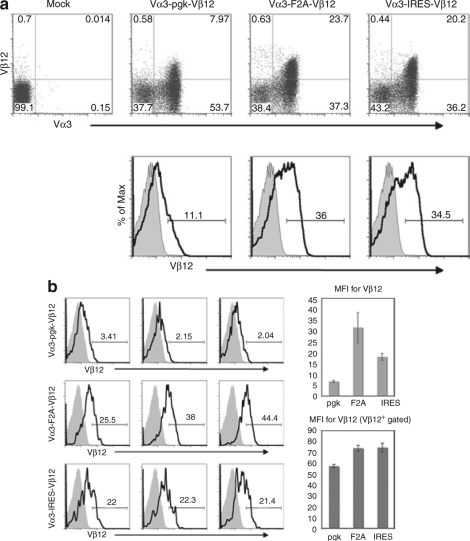
Figure 2.
Transduction efficiency and T-cell receptor α and β chain expression in P14 T cells. (a) P14 T cells were transduced with one of the three retroviral constructs shown in Figure 1 and incubated with antibodies to CD8α, Vα3, and Vβ12 2 days post-transduction. Dot plots were gated on CD8+ lymphocytes, and histograms were gated on CD8+, Vα3+ lymphocytes to illustrate relative levels of Vβ12 expression in transduced T cells compared to mock-transduced controls. (b) Histograms were analyzed as in a above to compare Vβ12 expression in three separate experiments. Means and standard deviations for the mean fluorescence intensity (MFI) of Vβ12 expression for the transduced T cells gated on CD8+, Vα3+ lymphocytes from the three experiments were calculated (right, upper bar graph). The means and standard deviations for the MFI of Vβ12 expression in transduced T cells were also calculated after eliminating T cells expressing low or absent levels of Vβ12 by gating on CD8+, Vα3+, Vβ12+ lymphocytes (right, lower bar graph). F2A, foot and mouth disease virus–derived 2A peptide; IRES, internal ribosomal entry site; pgk, phosphoglycerate kinase.

