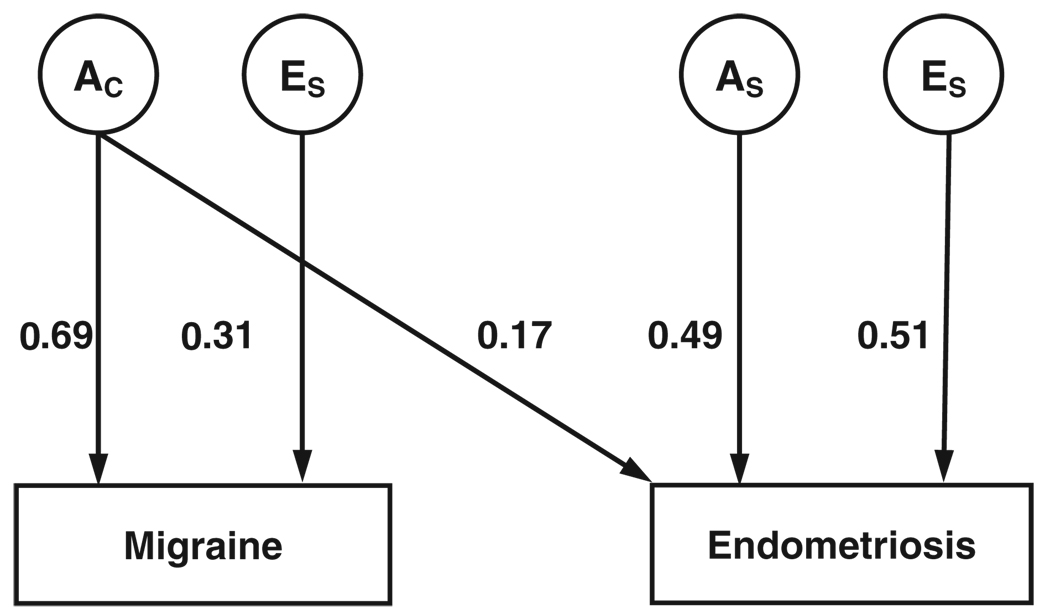
Fig. 1.
Path diagram of the best fitting bivariate correlated liability (triangular decomposition or “Cholesky” factor) model. Latent variables are represented by circles and phenotypes are represented by boxes. AC represents additive genetic influences common to migraine and endometriosis; AS and ES are specific additive genetic and non-shared environmental influences. Parameter values represent the standardised proportion of variance in liability accounted for by the latent variables.

