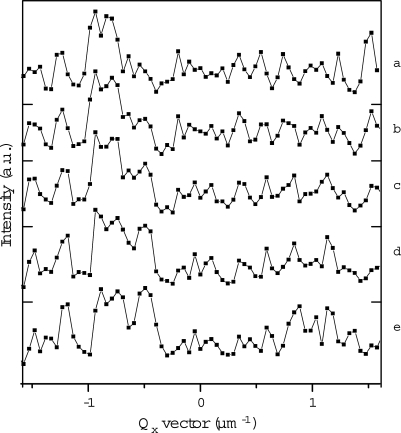
Fig. 4.
Intensity profile of the central line of the first meridional reflection between five ptychography positions along a line: a) position 0 μm, b) 2 μm, c) 4 μm, d) 6 μm, e) 8 μm. The intensity has been averaged along three neighboring lines (approximately equivalent to the size of one speckle). Each point corresponds to a CCD pixel. Each speckle can be seen to be about 2–3 pixels wide, sufficiently oversampled for phasing to work. Their gradual intensity changes with the probe position are noticeable. See for instance the Qx = 0.5 μm−1 region, where the intensity increase of one of the speckles is particularly clear.

