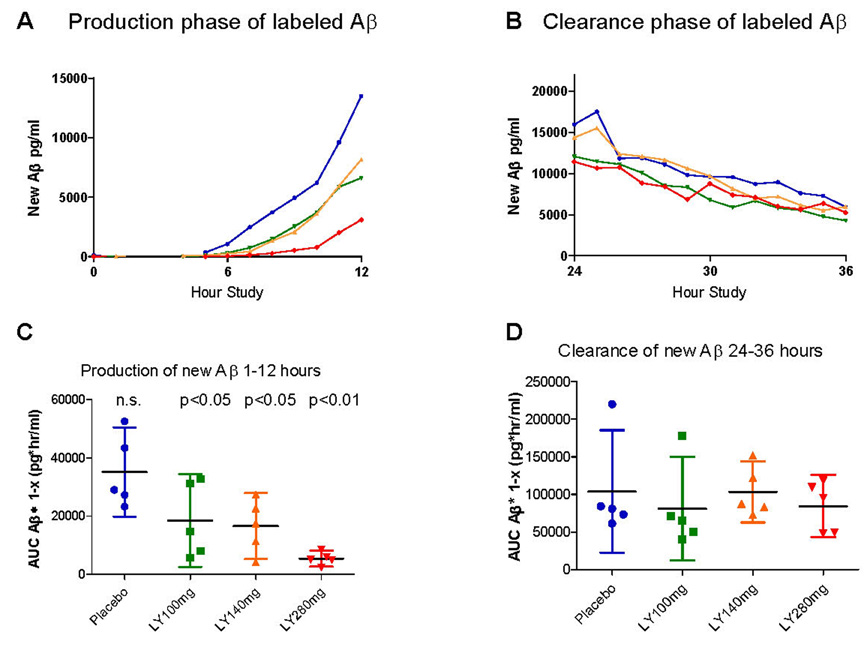
Figure 3. Area under the curve (AUC) analysis of newly generated Aβ.
A) A dose-response reduction in newly generated Aβ is present during hours 1–12. B) There was similar clearance of Aβ between hour 24–36. C). Individual AUC values for hours 1–12 (AUC1–12) of newly generated Aβ1–x for each participant is plotted according to dose as well as mean +/− 95% confidence intervals. There is a dose-dependent decrease in the production of Aβ. D) AUC for hours 24–36 (AUC24–36) of newly generated Aβ for each participant as well as mean +/− 95% confidence intervals are shown. There is no significant difference in Aβ clearance between groups.

