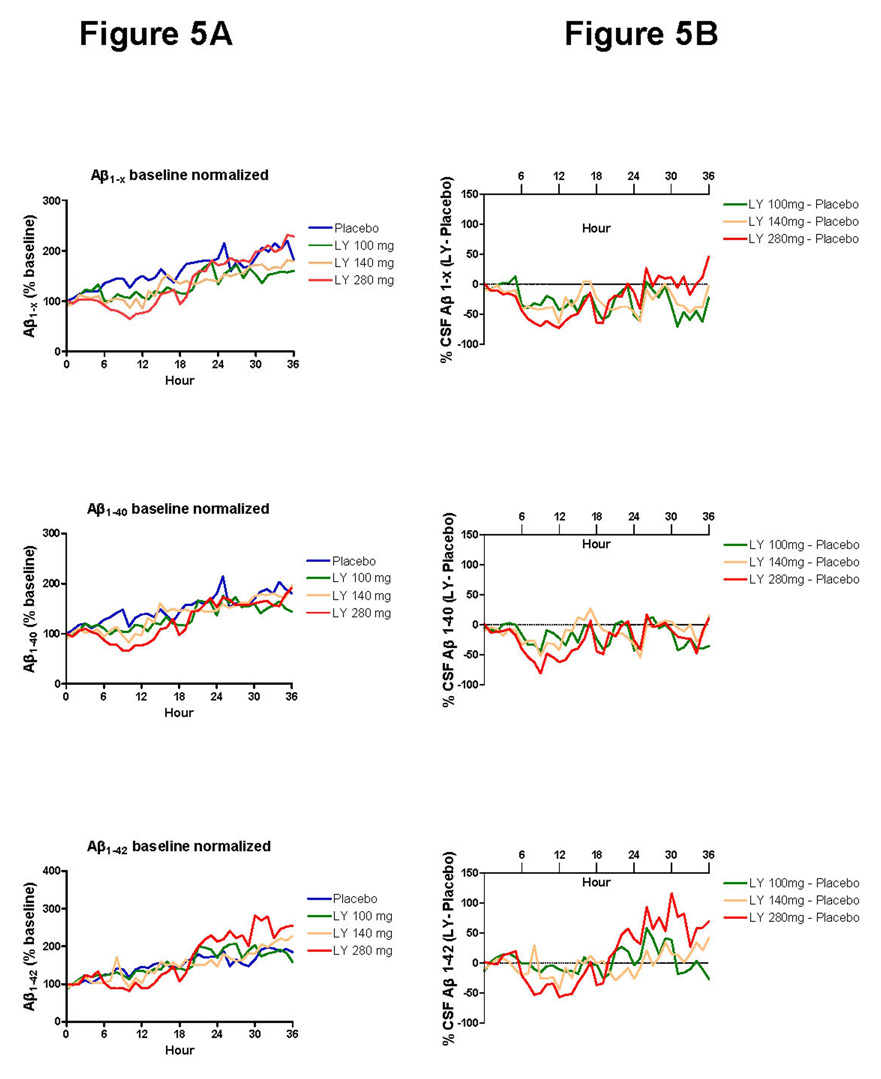
Figure 5. Normalized cerebral-spinal fluid Aβ levels measured by ELISA.
A. The average Aβ levels normalized to baseline values at hour 0 is shown for each group. There is a trend for increasing Aβ levels over time in the placebo and treated groups. The average standard deviation is 48 percent in the placebo group, and error bars are not displayed for readability.
B. The average Aβ levels for each group were subtracted from the placebo group values at each hour. Although fluctuations are present, there is a trend towards decrease in the Aβ1–x AUC1–12, with only LY450139 280mg dose being significant (p<0.05).

