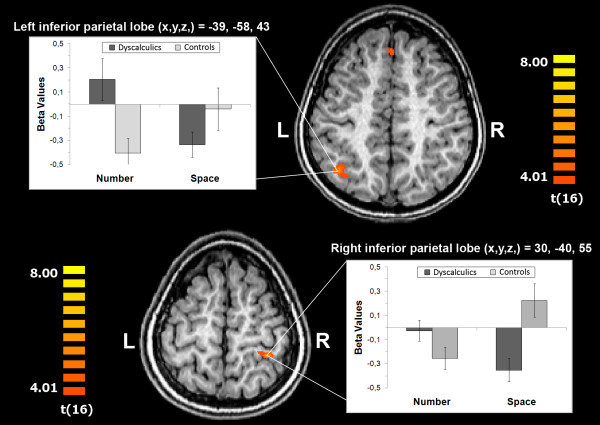
Figure 1.
Talairach coordinates of significant (intra)parietal activation differences between children with and without dyscalculia (dyscalculic children > controls) as obtained in the task-specific contrast number processing > spatial processing. In addition, mean beta-values for both parietal activation foci are plotted separately for task (number and space) and group (dyscalculic children and controls). Error bars denote standard errors of the mean.

