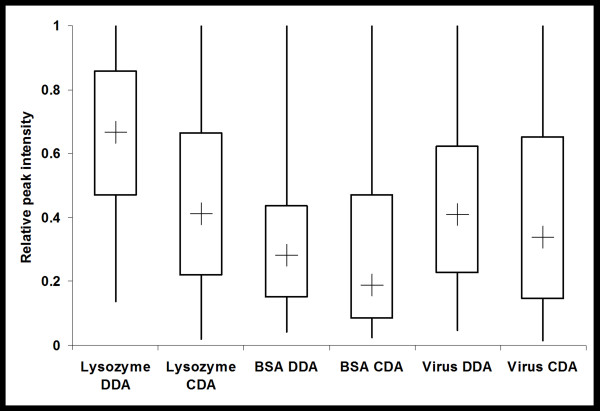
Figure 4.
Distribution of relative abundances of peptides sampled. The box-plot shows the distribution of the relative intensity of precursor ions of MS/MS (DDA) and reconstructed MS/MS-like (CDA) spectra for the lysozyme, BSA and whole virus preparation tryptic digest. The lines indicated the maximum and minimum relative abundances, the box edges indicate the first and third quartile of relative abundances and the cross (+) indicates the median relative abundance.

