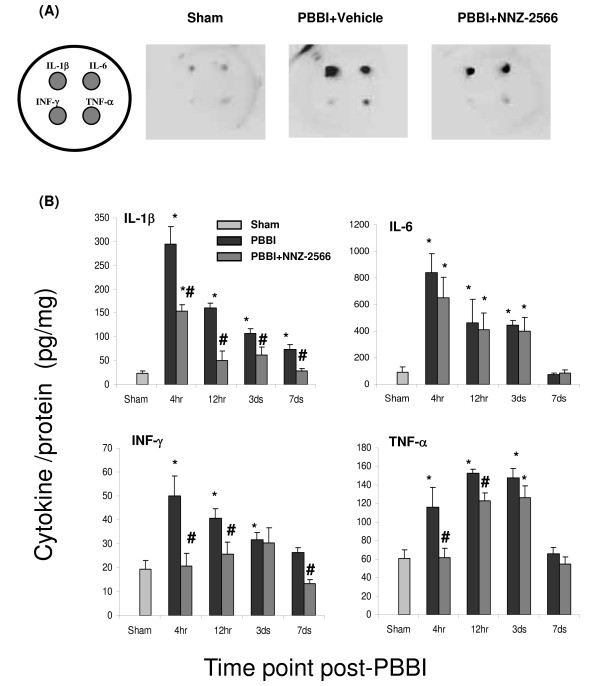
Figure 4.
Multiplex cytokine array analysis of cytokine levels following PBBI. NNZ-2566 treatment is similar to that listed in legend of figure 3. (A) Schematic indicating the orientation of cytokines (IL-1β, IL6, INF-γ, and TNF-α) and representative images of chemiluminiscent intensity from the multiplex array (4 hours after PBBI). (B) Quantitative analysis from the multiplex array measurements. The cytokine levels are given as the mean ± standard error (n = 6 per group). *P < 0.05 as compared to the sham, and # P < 0.05 as compared to PBBI with the vehicle.

