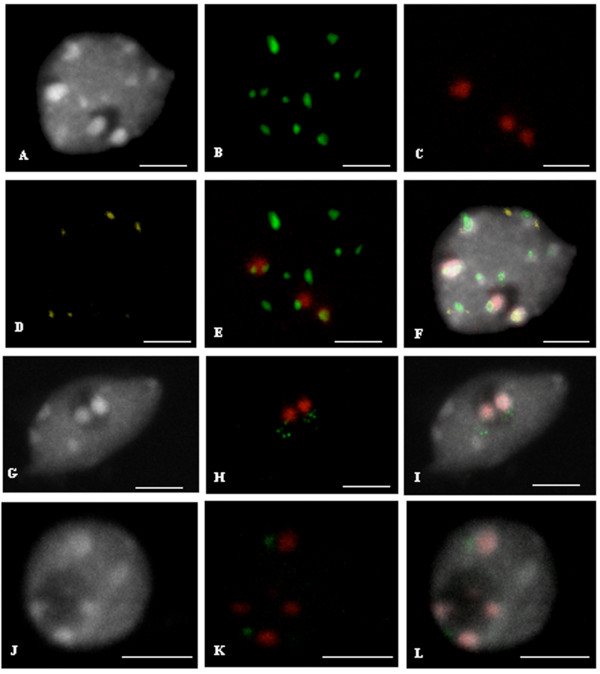
Figure 1.
FISH on isolated interphase nuclei. (A, G, J) DAPI staining. (B) centromeric 180 bp repeats (Alexa Fluor® 488-5-dUT, green). (C) 45S rDNA (Cy5-dUTP, red). (D) 5S rDNA (Cy3-dUTP, yellow) (E) Merge with 180 bp repeats and 45S rDNA visible as green and red, respectively. (F) Merge with DAPI, 180 bp repeats, 45S rDNA and 5S rDNA. Bar = 2 μm. (H) FISH with 45S rDNA and T1J1 BAC specific of chromosome 4, visible as red and green signals, respectively. (I) Merge. Bar = 4 μm. (J, K, L) FISH on an isolated interphase nucleus. (J) DAPI. (K) 45S rDNA and BAC T6P5 specific of chromosome 2, visible as red and green, respectively. (L) Merge. Bar = 2 μm. All images are maximum projections of confocal image stacks.

