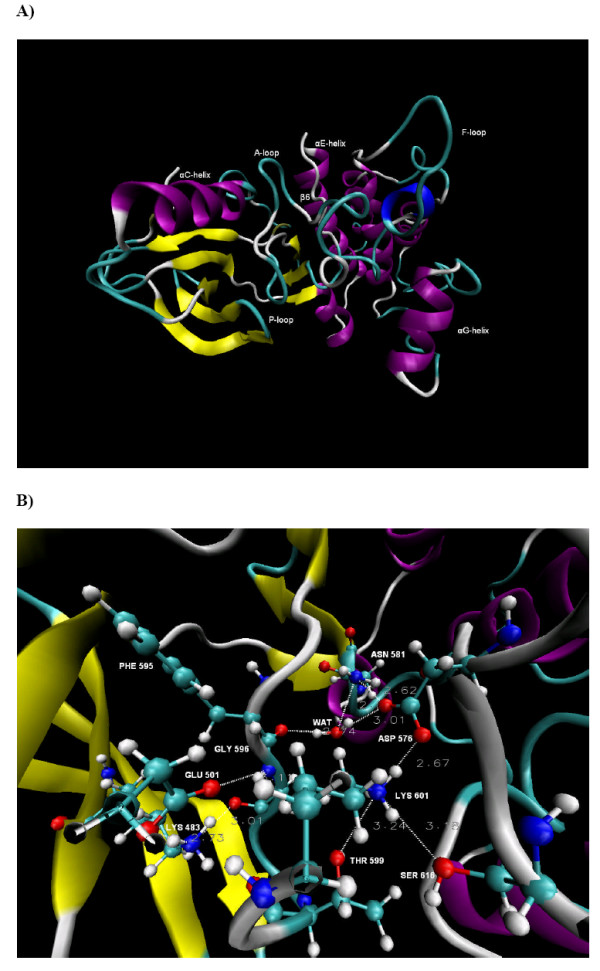
Figure 6.

B-RAFD594V. A) The conformation of B-RAFD594V after 15 ns of simulation time. B) A close look at the conformation of the major catalytic residues and the identified hydrogen bond network in the unbounded B-RAFD594V after 15 ns of simulation time. The dotted lines and the adjacent values represent the H-bonds and their distances.
