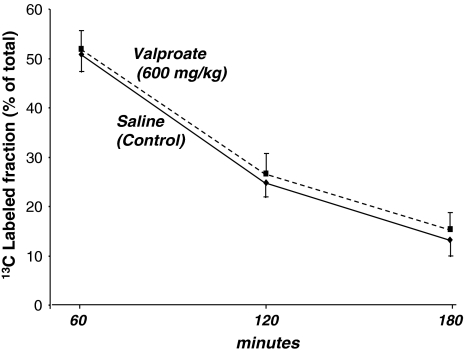
Fig. 2.
Intraperitoneal 13C tracer glucose tolerance test (IPGTT). Glucose 13C labeled fractions as per cent of total glucose in plasma (Y axis, Σmn=C1–C6) which includes all 13C-labeled positional isotopomers of glucose at 0, 60, 120 and 180 min (X axis) after tracer load. Control and VPA-treated animals show virtually identical 13C labeled glucose fractions in plasma indicating similar absorption and clearance of tracer glucose at all time points. Control (lower continuous line) or VPA (upper broken line) glucose 13C-labeled plasma fractions as independent variables are compared using regression analysis to corresponding plasma cholesterol 13C-labeled fractions as the dependent variable to determine glucose to cholesterol flux by liver metabolism in Tables 1 and 2 (mean + standard deviation (SD); n = 8)

