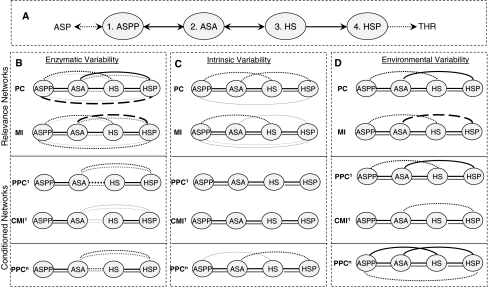
Fig. 2.
Inference of threonine synthesis pathway in E. coli by different similarity approaches. (a) The real pathway, (b) network inference by enzymatic variability, (c) network inference by intrinsic variability (d) network inference by environmental variability. Black lines are edges for non-pruned networks whereas gray lines show edges for pruned networks. Dashed and dotted lines imply ambiguity regarding the corresponding edges (i.e. edge is absent or present depending on different realizations). Dashed lines mean presence of the edge in at least 90% of 100 realizations, and thin dotted lines mean presence of the edge in only at most 10% of the cases. Normal dotted lines correspond to cases in between. ASP aspartate, ASPP aspartyl-P, ASA aspartic semialdehyde, HS homoserine, HSP O-phospho-homoserine, THR threonine

