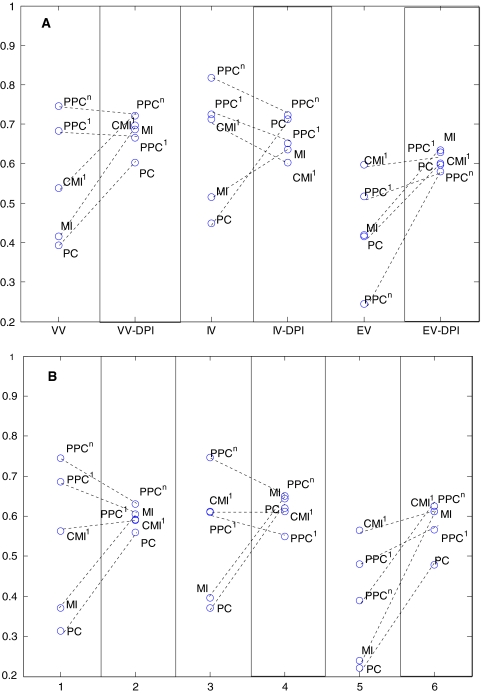
Fig. 4.
Geometric mean score of sensitivity and specificity for aS. cerevisiae and bE. coli systems. The g-scores are for P = 0.01 threshold for similarity measures. The x-axis of figures correspond to the pruned and non-pruned versions of three variability approaches with VV: enzymatic variability, IV: intrinsic variation, EV: environmental variation; and block names with DPI corresponding to pruned versions. Pruned and non-pruned versions of the same similarity score for the same type of variability was connected to each other by dotted lines to show the effect of pruning. Higher g-scores correspond to better inference

