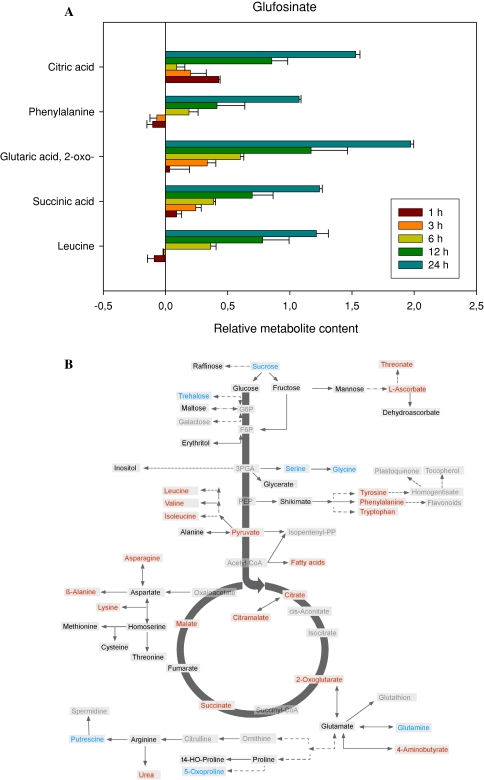
Fig. 2.
Metabolic changes following treatment of Arabidopsis thaliana plants with the herbicide glufosinate. The graph shows the five most variant metabolites samples to the left of the line are increased in content following treatment, samples to the right are decreased in content following treatment. Data are presented on a logarithmic (base10) scale and are the mean of four independent samples. The full dataset is viewable in Supplemental Table I

