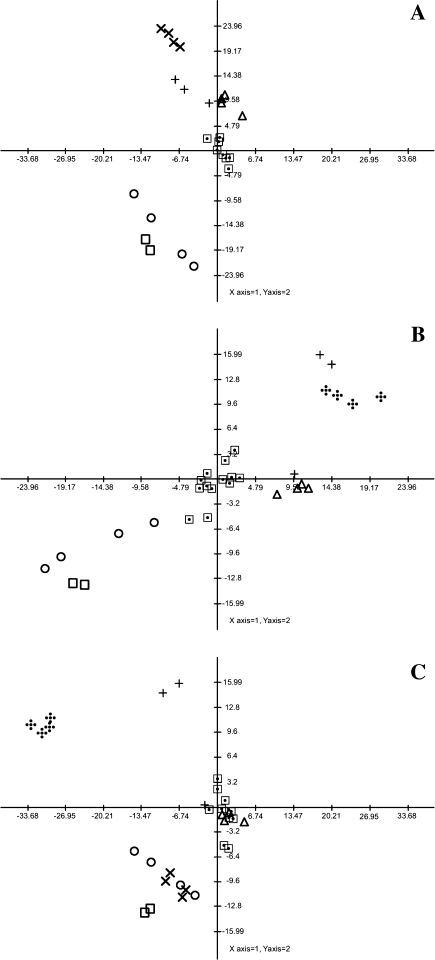
Fig. 8.
Principal component analysis (PCA) of metabolite profiles following 24 h treatment with distinct herbicides. The PCA is presented as a combinations of the first three dimensions. Each data point represents an independent sample. The analysis of this data was performed using the TMEV software (Saeed et al. 2003). ⊡ untreated plants;  glufosinate; ◯ sulcotrione; □ AE 944; × foramsulfuron; + benfuresate; Δ glyphosate

