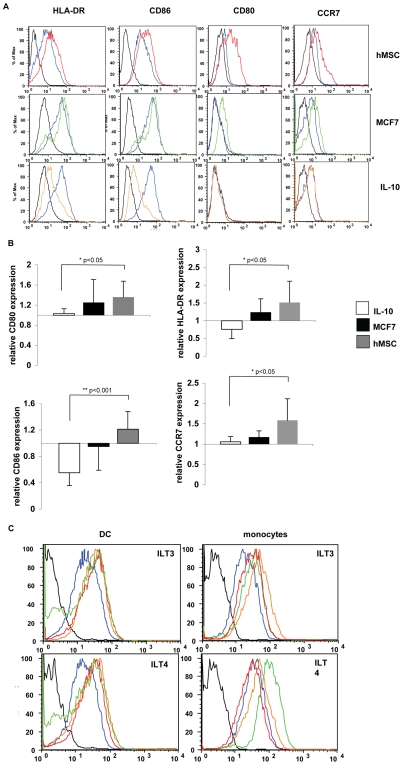
Figure 7. DCs exhibit altered matured phenotype upon cell:cell interaction but not after incubation with soluble factors.
DCs were either incubated alone, co-cultured with hMSC (top panel) or MCF-7 (middle panel), or were treated with IL-10 (10 ng/ml; lower panel). After 24 hours, the cells were collected and the levels of HLA-DR, CD80, CD86 and CCR7 surface expression on DCs were determined by immunofluorescence and flow cytometry. Black line: isotype control; blue line DCs alone; Red line: DCs co-cultured with hMSC; Green line: DCs co-cultured with MCF-7; Orange line: DCs treated with IL-10 one representative experiment is shown (A). Mean fluorescent intensity (MFI) results as in A from 5 experiments were normalized and are presented as relative to the level of expression by DCs cultured alone (B). Either DCs or monocytes treated as above were further tested for surface expression of ILT3 and ILT4 by immunofluorescence and flow cytometry. Black line: isotype control; blue line: DCs or monocyes as indicated, alone; Red line: co-culture with hMSC; Green line: co-culture with MCF-7; Orange line: incubation with IL-10 (C).

