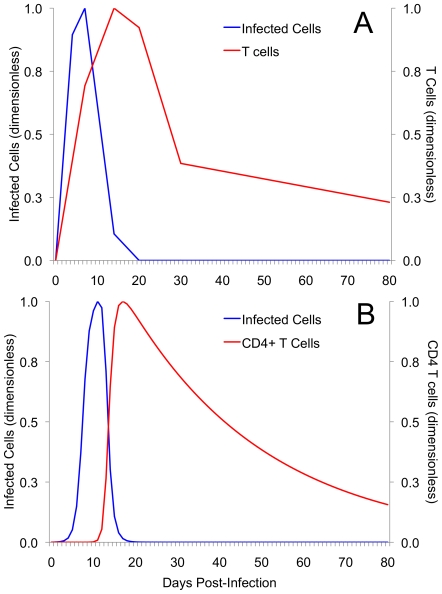
Figure 2. A comparison of experimental and simulated kinetics of primary chlamydia infection and CD4+ T cell responses.
(A) Experimental data for infected cells and T cells at initial infection. Data are modified from Igietseme and Rank [5]. Female guinea pigs were infected with the same amount of Guinea Pig Inclusion Conjuntivitis (GPIC) chlamydia bacteria. (B) Simulated behavior of infected cells (Y) and CD4+ T cells (Z) for the basic model demonstrates similar qualitative behaviour when calibrated to approximate part (A). While both basic and extended models reproduced experimental behaviour, only the results of the basic model are displayed. For comparison of qualitative behaviour, both experimental and simulated data for infected cells and T cells have been scaled and are displayed non-dimensionally.

